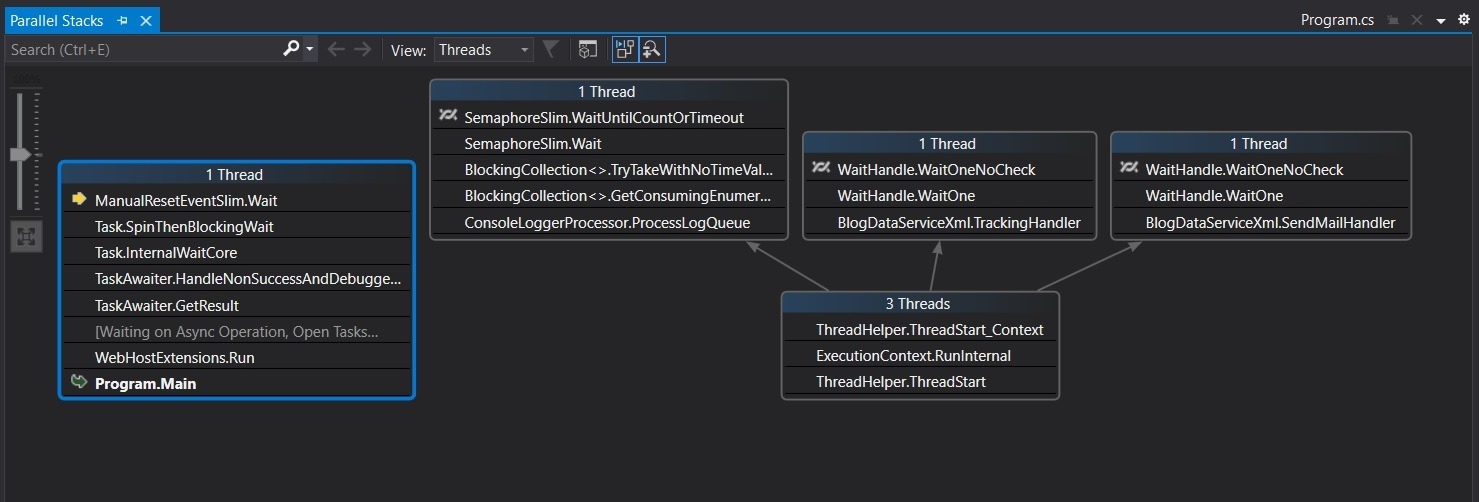
The debugger team have been working really hard on the improving the ways in which you can visualize asynchronous code! The Parallel Tasks window (Debug->Windows->Parallel Stacks) provides an improved graphical representation of the actual and virtual call stacks. You can now see whether you are waiting on a lock that might be held by another thread, or visualize a virtually stitched stack where your code is waiting on an async operation.
The above illustrates that the root of 3 threads have identical call stacks, this can be very useful if, for example, the thread pool threads are queued up and you are trying to find the pattern that causes the issue. From my perspective this is really compelling in that it not only works when you are debugging code but it is also helpful when you open a memory dump in Visual Studio and want to see which threads have similar origins. If this were WinDbg I might try run this command to get a comparable view:
~ * e !ClrStack
My good friend and colleague Leslie Richardson has just finished a great blogging series on async debugging along with this insightful companion video:


Comments are closed.