There is just a ton of information buried in your dumps, you should really think about it as a snapshot, or as moment in time when your debugger has paused at a breakpoint. This means that most of the tools you use during live debugging can be used in postmortem dump debugging too.
One of the basic tasks of dump debugging includes searching through the dumps for specific objects you might interested in, or specific values on those objects you want to confirm and validate. If you were debugging using WinDbg and wanted to find all the references to particular type of object you might use this command for example:
!dumpheap –mt methodtable
You could then use a dump object command to shows properties of the specific objects including the objects value.
!dumpobj address
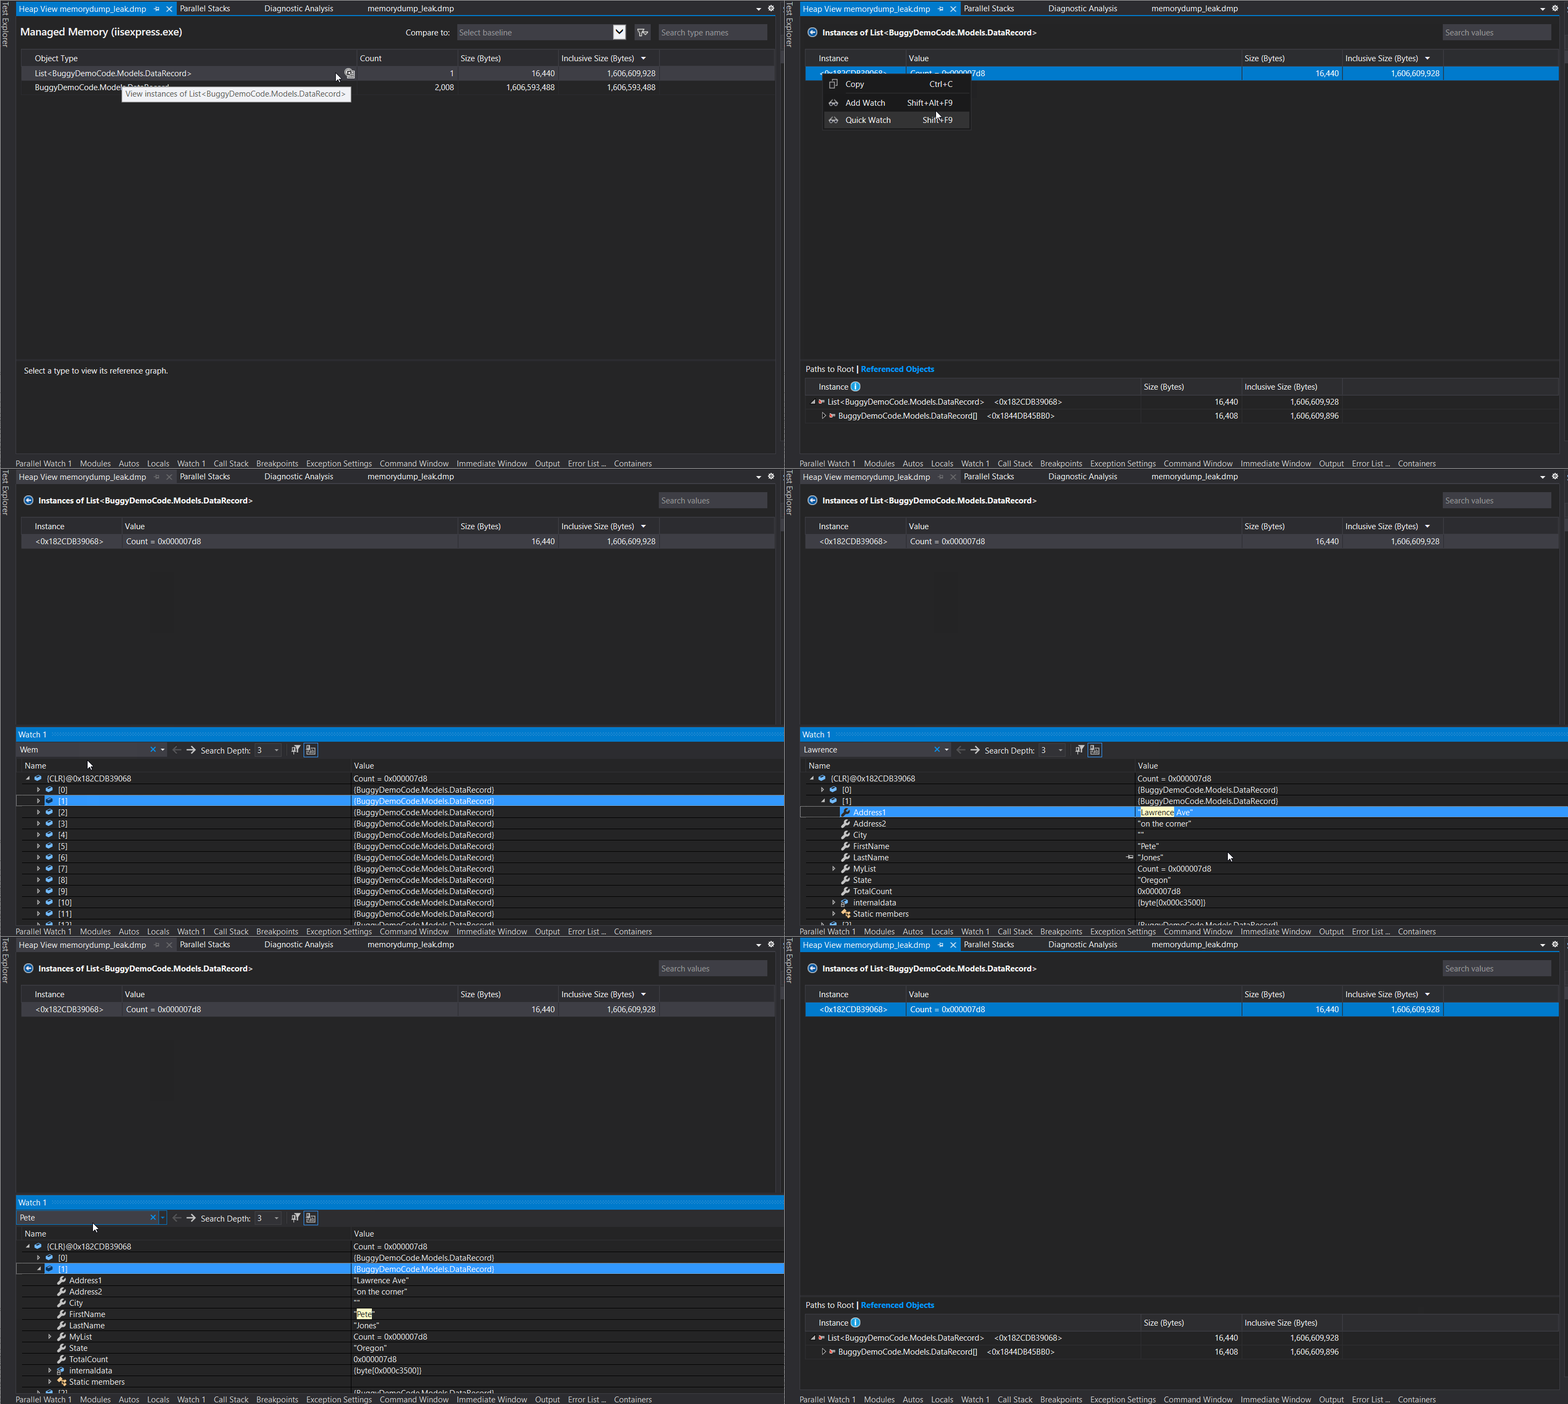
You can do the equivalent type of analysis in Visual Studio Enterprise! If you open a memory dump in Visual Studio you have a bunch of Actions to choose from on the Dump Summary Page that includes Debug Managed Memory.
The Debug Managed Memory option opens the Memory Tool with a list of objects represented on the heap and you can select and hit enter (or right click and View Instances). Once you have the instance list you can add it to Quick Watch if you know exactly what you are looking for, or my preferred approach is to simply Add Watch. In the following gif I add a List<> to the Watch window for analysis:
Note how the format of each instance is presented in the Watch window (or Quick watch window) as {CLR}@ADDRESS, which asks the debugger to present the CLR object found at that address. Now that I have the List of objects in the Watch window I can use the powerful search feature (including Search Depth) to find any value or type anywhere in that rather large List.
I think this is a fairly efficient approach in most scenarios, happy debugging!


Comments are closed.