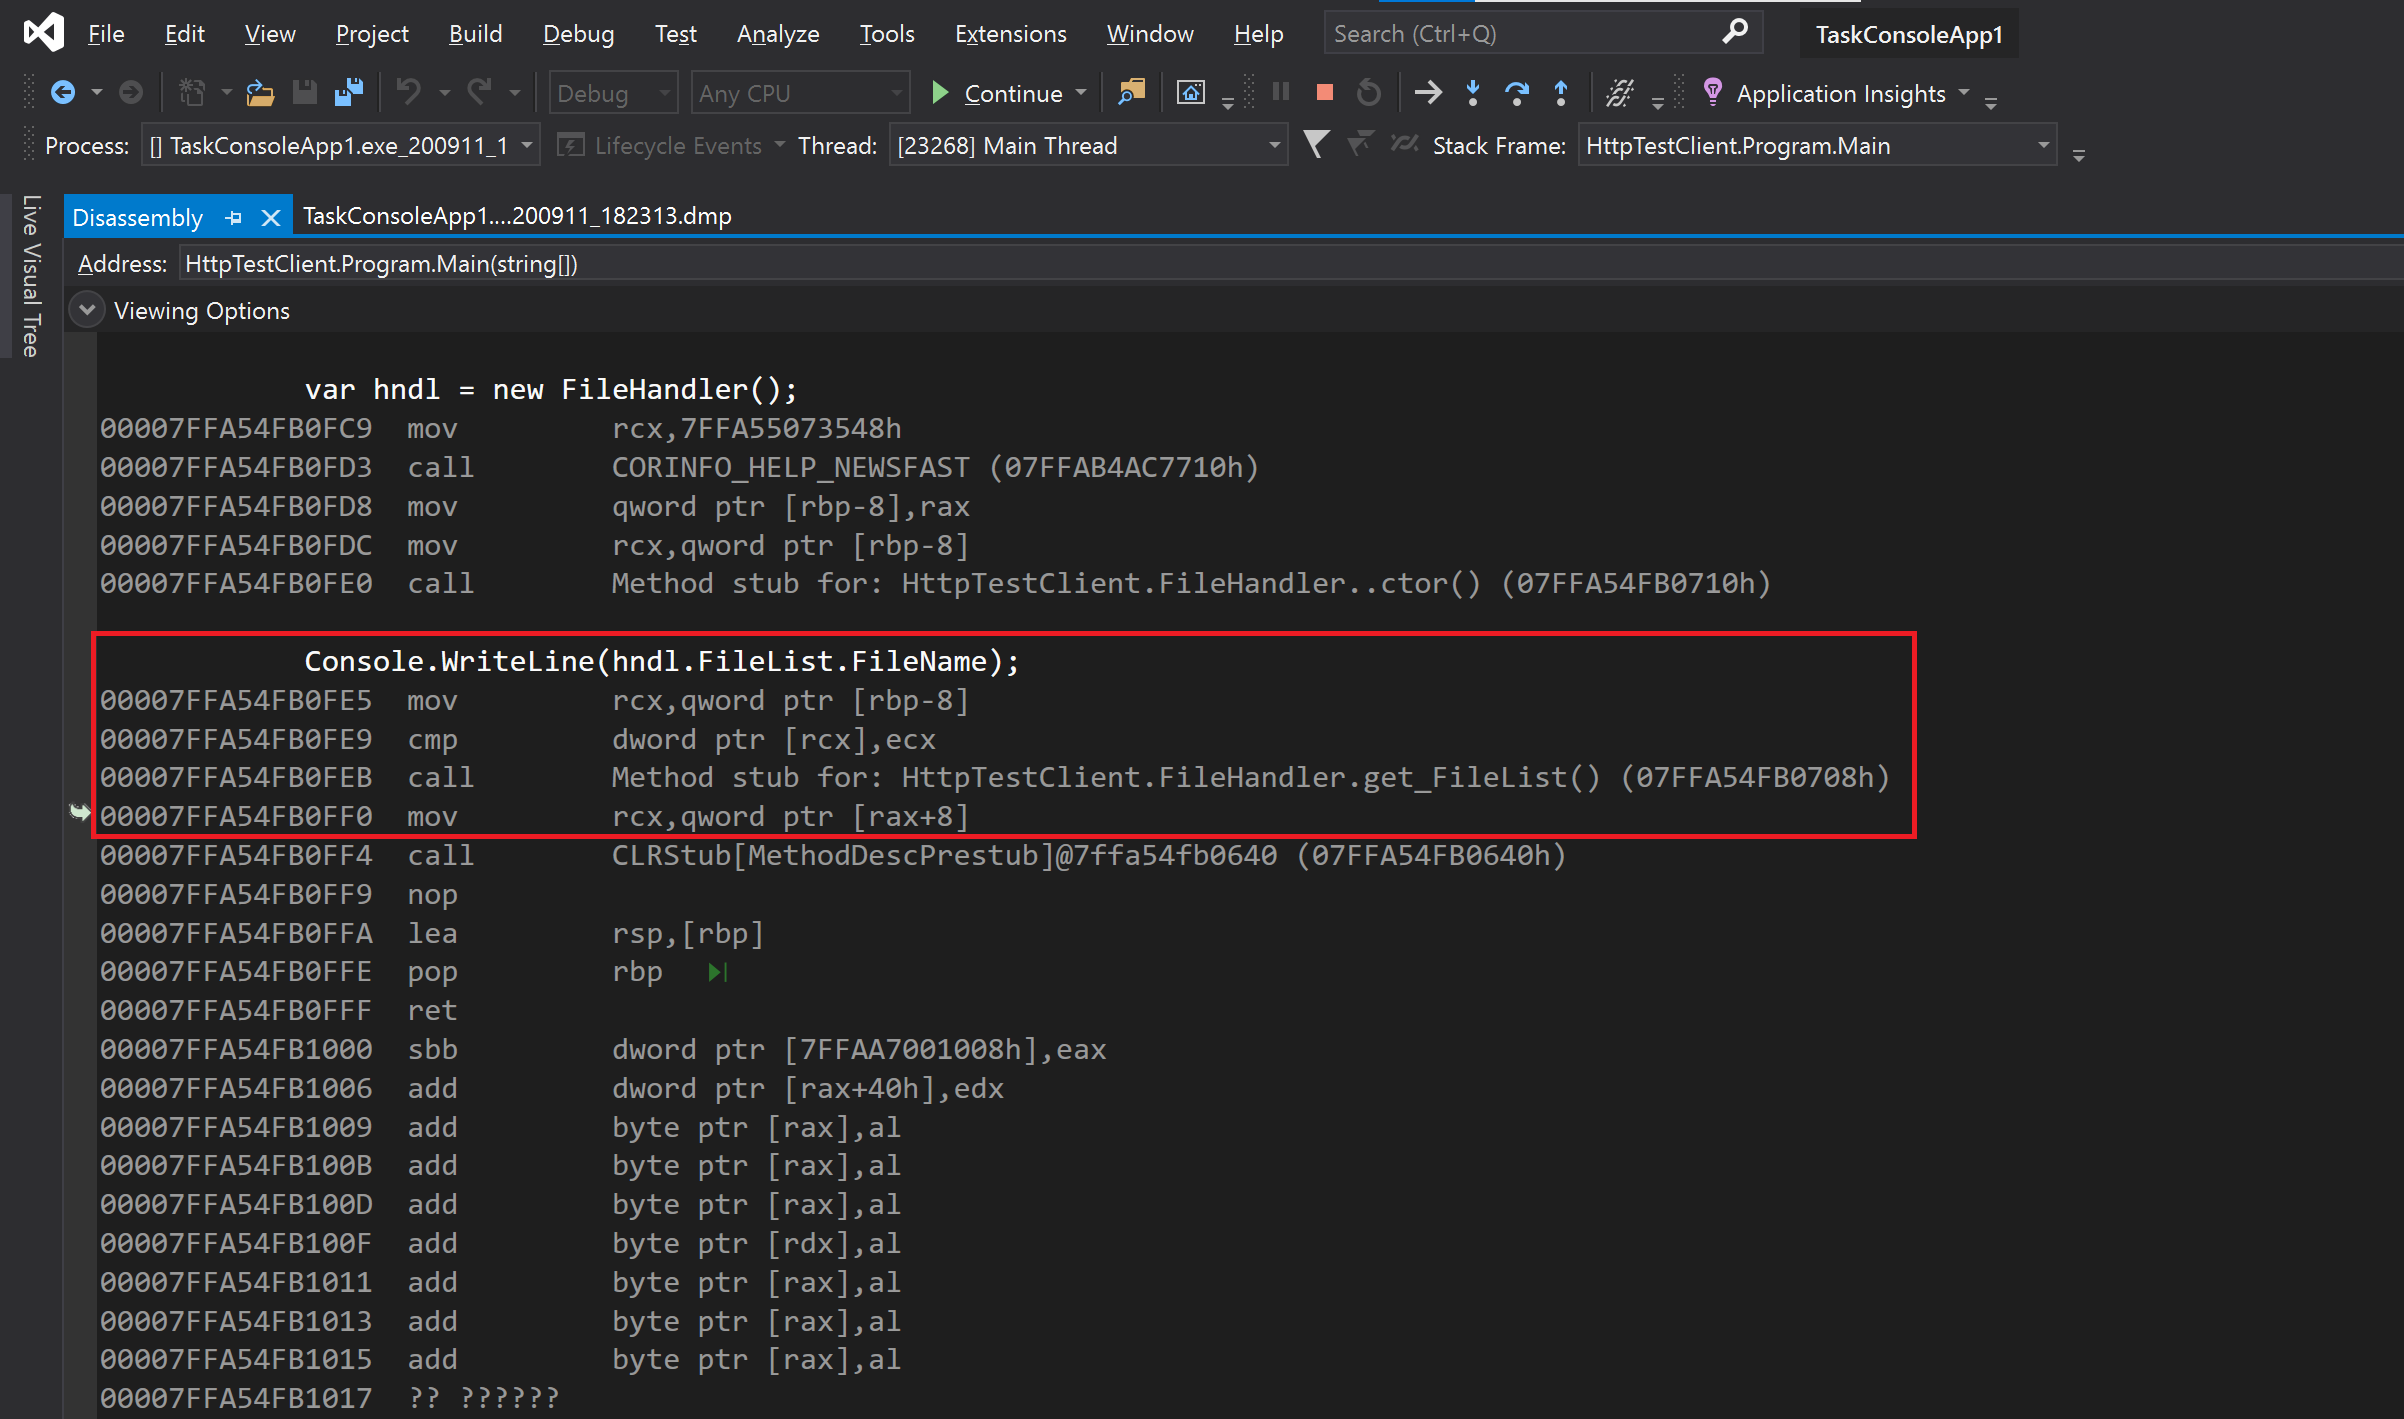
I recently blogged over at the Visual Studio site on the topic of the Disassembly tool improvements for Visual Studio.
If you are focused on squeezing out the last bits of performance for your .NET service or application, you might choose to take advantage of JIT compiler optimizations. However, debugging optimized code can be a challenge. In this blog I’ll show you how the Disassembly Window, and the recent improvements in 16.7, can help you debug optimized code.
When you are debugging optimized code you might see the following:
- Breakpoints may not always bind to the matching sourcing location.
- Stepping may not always step to the correct location.
- Some variables may not be available for evaluation.
In these cases you might consider using the Disassembly window to show the assembly code that corresponds directly to the instructions created by the compiler. If you’re debugging managed code, then the assembly instructions relate to the native code created by the Just-in-Time (JIT) compiler.
Anyway check out more of the blog details here.


Comments are closed.