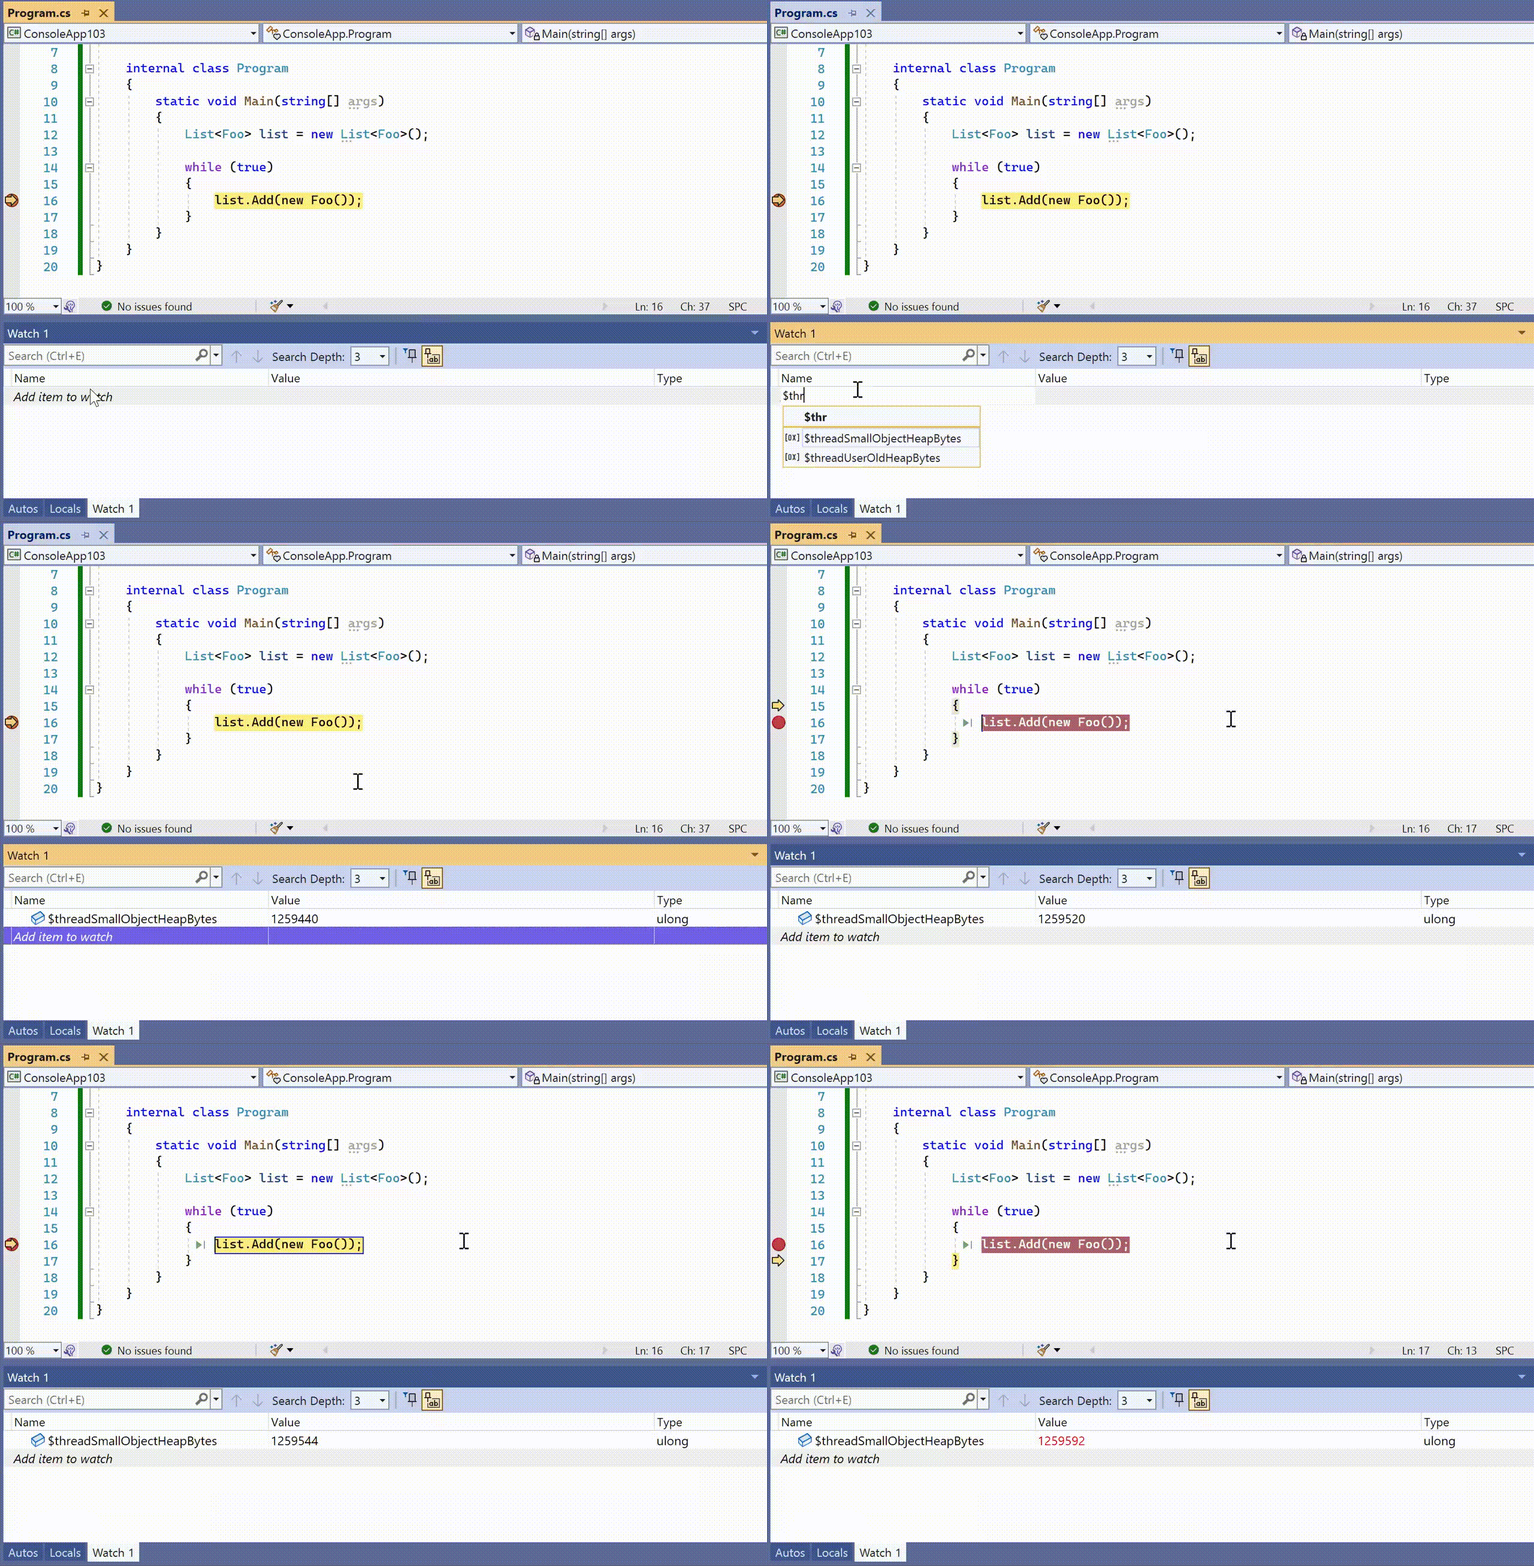
Back with the release of .NET 5 a new kind of heap was added to runtime called the Pinned Object Heap (POH). Pinning has been around for a long time, however, it is considered a niche scenario, and not something I would expect most app or service developers to worry about. The act of pinning itself makes an object stay in a specific memory location for a lot longer, and the GC needs to handle this in a special way. Reading about POH reminded me of the way the GC treat objects in the Large Object Heap (LOH), they tend to to be looked at and moved less often due to the expense.
User Old Heap
As the POH and LOH are treated in similar ways, the .NET team coined a new term to encapsulate them both, User Old Heap (UOH). You can think of the UOH as follows:
User Old Heap = Large Object Heap + Pinned Object Heap
A quick recap of the heaps might be helpful here. Creating a new object (under 85000 bytes) will typically be assigned to Generation 0 which is part of the Small Object Heap (SOH). However, if it is large enough it gets categorized as part of the LOH. Alternatively, you can explicitly request an allocation be assigned to the POH using the GCHandle class.
Tracking where your allocations end up can be incredibly important to determine the health of your application. In most instances I see developers log the GC.GetAllocatedBytesForCurrentThread to track the allocations of an executing thread.
New pseudovariables in Visual Studio
What I am excited to see with the release of .NET 6 and Visual Studio 2022 is that you can now track the allocations in either SOH or UOH in the Watch Window. You can use the new debugger pseudovariables $threadSmallObjectHeapBytes (for SOH) and $threadUserOldHeapBytes (for UOH) in the variable window or the Quick Watch dialogue.
Happy debugging!


Agreed! At some point complexity or volume of use (or something) forces you to learn more about the abstraction layer that you might have been able to ignore. Hopefully most developers never have to worry about it.
Comments are closed.