One of the key goals for Visual Studio was to fully embrace the scalability of the 64-bit platform. For most developers that means Visual Studio is more capable of using the available resources to improve the reliability of Visual Studio especially when working with large and complex solutions. However, the 64-bit conversion effort really did impact every part of the Visual Studio debugging experience and for a diagnostics nerd like me that includes artifacts like traces and memory dumps.
When we announced Visual Studio 2022 Preview 1 one of the first questions I got was “I have a massive memory dump, can Visual Studio open it now?”. To be perfectly honest I was not sure what the upper limit for viewing dumps would end up being. Simply testing this was difficult because the process of artificially creating an environment for large memory dumps is not that easy, plus managing files this big gets a little tricky, on top of that we were not sure if it would reflect customer usage.
Opening a super massive memory dump (about 49GB!)
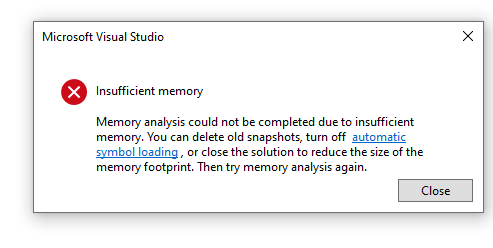
Since joining Microsoft I have had multiple internal teams need to debug memory dumps in the order of 14-30GB! This, apparently, is perfectly normal for a lot of teams, but it presented our 32bit Visual Studio predecessor with a lot of problems. In fact you would probably get an Insufficient memory message like this one:
So I shared this data with the debugging team and they were able to provide updates for the latest release of Visual Studio 2022 that allowed our internal teams to open a memory dump as large as 49GB with over 336 million objects!
49GB is an almost impractical file size to manage but I am little obsessed with finding out what our upper limit is for super massive memory dumps. So if you have a massive memory dump, try opening it in Visual Studio and please let me know how it goes via the Developer Community portal.
p.s. Remember this also works for Linux managed memory dumps too!


Comments are closed.