One of the developer journeys I have focused on at Microsoft includes the diagnostics and debugging flow that typically start in a production environment. I have been that on call developer who is trying to figure out why things are slow, or crashing, or consuming so much memory. Even after years of experience it can be difficult to figure out where to start. In many scenarios this typical begins and ends with logs, but more complex issues can require a trace or dump (including GC Dumps).
On this blog I have advocated learning some of the many WinDbg commands but I am realizing very few developers ever get comfortable using the tool let along mastering it. To that my team introduced Diagnostic Analysis as a feature that would highlight the most pertinent information that a veteran dump debugger might turn to validate the health of an application.
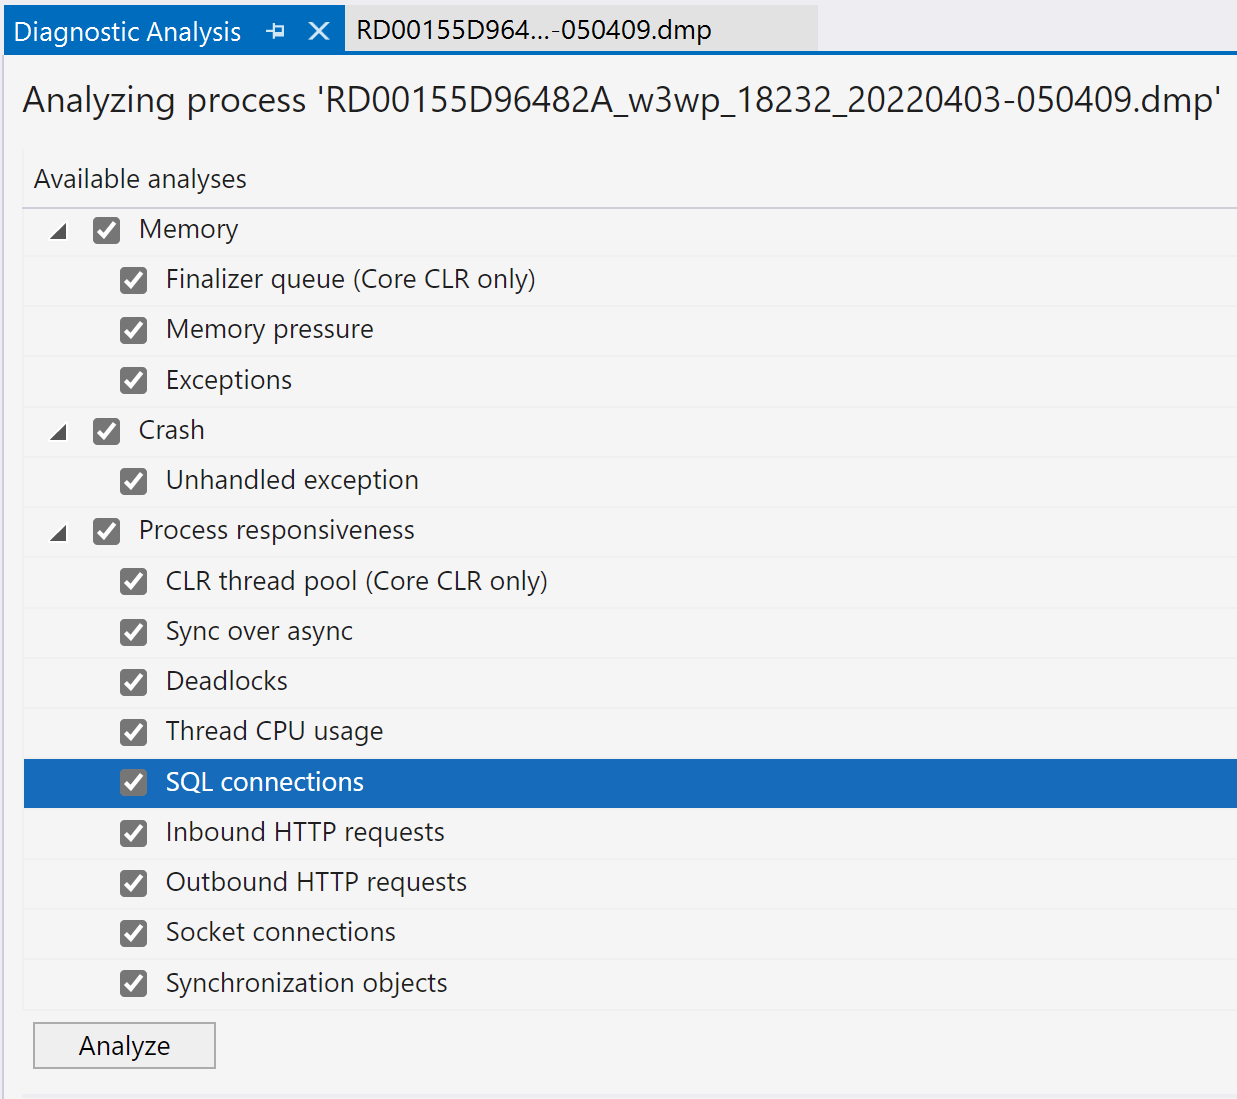
When we started this process we only had about 5 analyzers for dumps, here is the list we have enabled so far:
- Finalize queue
- Memory Pressure
- Exceptions
- Unhandled Exceptions
- CLR Thread Pool
- Sync over async
- Deadlocks
- Thread CPU Usage
- SQL Connections
- Inbound HTTP Requests
- Outbound HTTP Requests
- Socket Connections
- Synchronizations objects
This list is growing! We also have analyzers in the works dedicated to things like Timer queues that can be a bear to track down.
Diagnostics Analysis for Profiling
We have now started looking at auto analysis in the context of profiling with Visual Studio 17.2. Profiling is a really versatile diagnostics technique which is can be more popular than dump debugging in many scenarios. Currently, there are only a few rules such as the use of overzealous string concatenation, but we are working with the .NET team to add more rules and tips. There is a lot of prior art that might be valuable here, I am especially interested in memory performance analysis. That article has great details on the approach and methodology to analysis that I am hoping, somehow, to replicate.


1. Edit Code and build
2. Commit
3. Run test with profiling
4. Do a perf check
5. if(!Good) goto 1
I would like to keep the profiling data around with the commit ID to be able to quickly query the profiling data data accross commits.
For performance regression tests I have written a tool: https://github.com/Siemens-Healthineers/ETWAnalyzer which comes close. I want to quickly query all past profiling runs to find the best version of a performance change which it not only fast but also uses low CPU/Memory ...
Thanks
Mark
Comments are closed.