I saw a really intriguing request from a customer who was trying to find someway to look at Offset or Size of an object in memory. They made several really intriguing suggestions about how this kind of info might be displayed in Visual Studio’s Locals or Watch windows. There is a lot to consider here, as this is a relatively expensive operation, so we are talking about it internally and I would suggest voting if you like the idea, the feedback helps us set the priority.
In general I find this kind of analysis really helpful when you want to track down issues with the size or contents of specific instance of an object among the hundreds that may exist. While we work through the details of this request, I would like to point out that there is a still a way to see the size of an instance of an object and its members in memory.
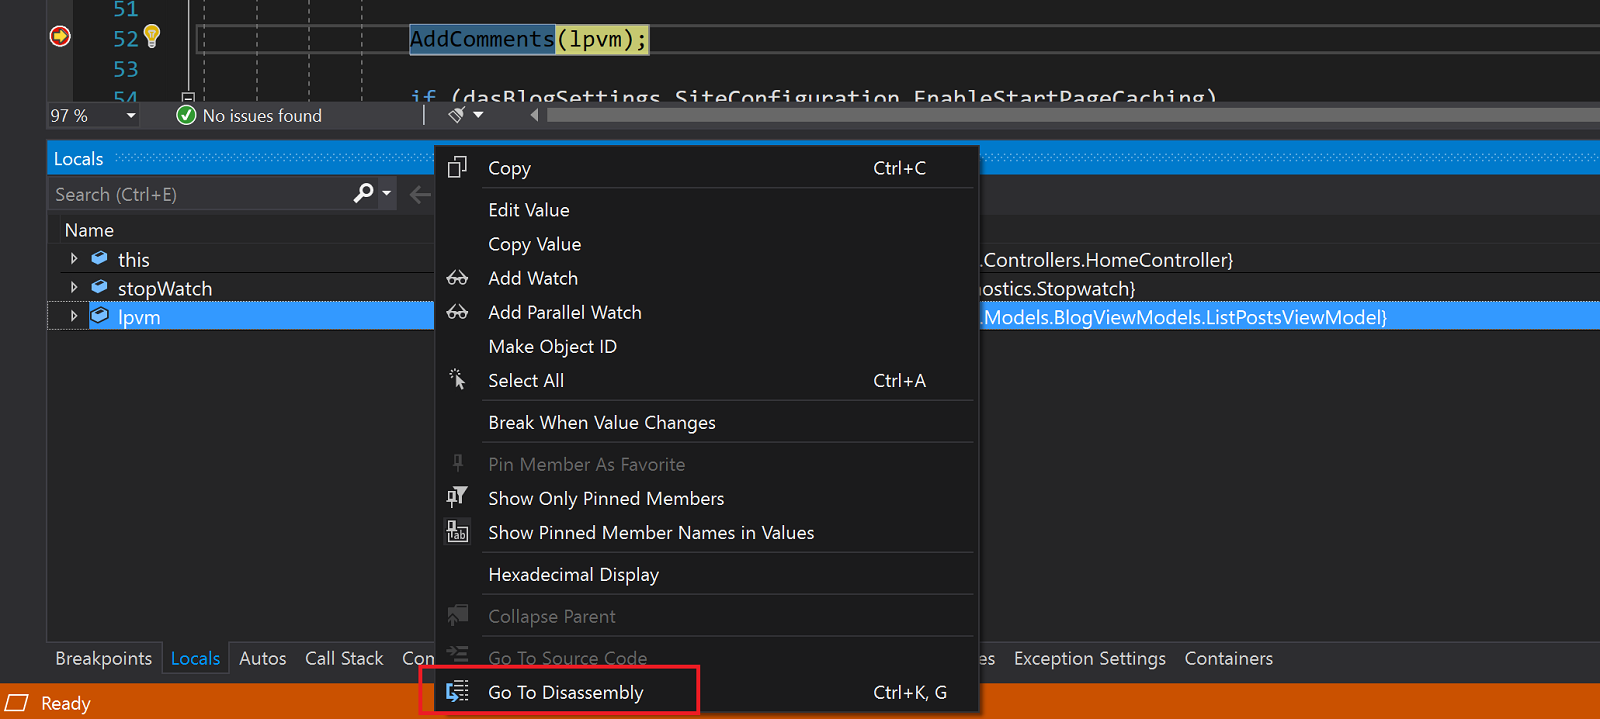
I would place the object in question in the Locals or Watch window right click the object and select Go To Disassembly as shown here:
This will go to the line in the Disassembly window where you can get the address (first column) of the object in question, in this example the address is 000002575E78C0D8 (this will be important later).
If you are live debugging you should take a Snapshot of the process, we can do this by navigating to the Diagnostics Tool (Debug->Window->Show Diagnostics Tool) and clicking Take a Snapshot. Click View Heap and this will open up the Memory Usage Tool which has a list of objects on the heap. Alternatively if you are opening a memory dump you already have a memory “Snapshot”, by definition, and by clicking Debug Managed Memory you get access to the Memory Usage Tool’s heap view.
Either way you end up at the Memory Usage Tool and you can search for the type that interests you, in this case I am looking for a DasBlog Core type called ListPostsViewModel:
When I double click on the Object Type I can get to see a list of instances of that type, of course the following example is a list of one, but I am usually dealing with dozens or hundreds of instances.
Now each instance will have an address (as seen in the Instance column) so you can match that address with the one you originally collected from the Disassembly window below:
This now permits a view of the Size (Bytes) and Inclusive Size (Bytes)!!!
One additionally trick if you select the Reference Objects view at the bottom of the page you can also see the Size and Inclusive Size of all the public properties this instance.
Note: Managed Disassembly accuracy has been improved greatly in Visual Studio 16.7+, in truth it was often woefully inaccurate especially when dealing with an optimized dump.


Comments are closed.