So I love the idea that developers should focus on the abstraction layer that makes them productive and happy, even if others disagree. I also believe it is my job to encourage exploration or even help fill the gaps in layers above you that might assist others.
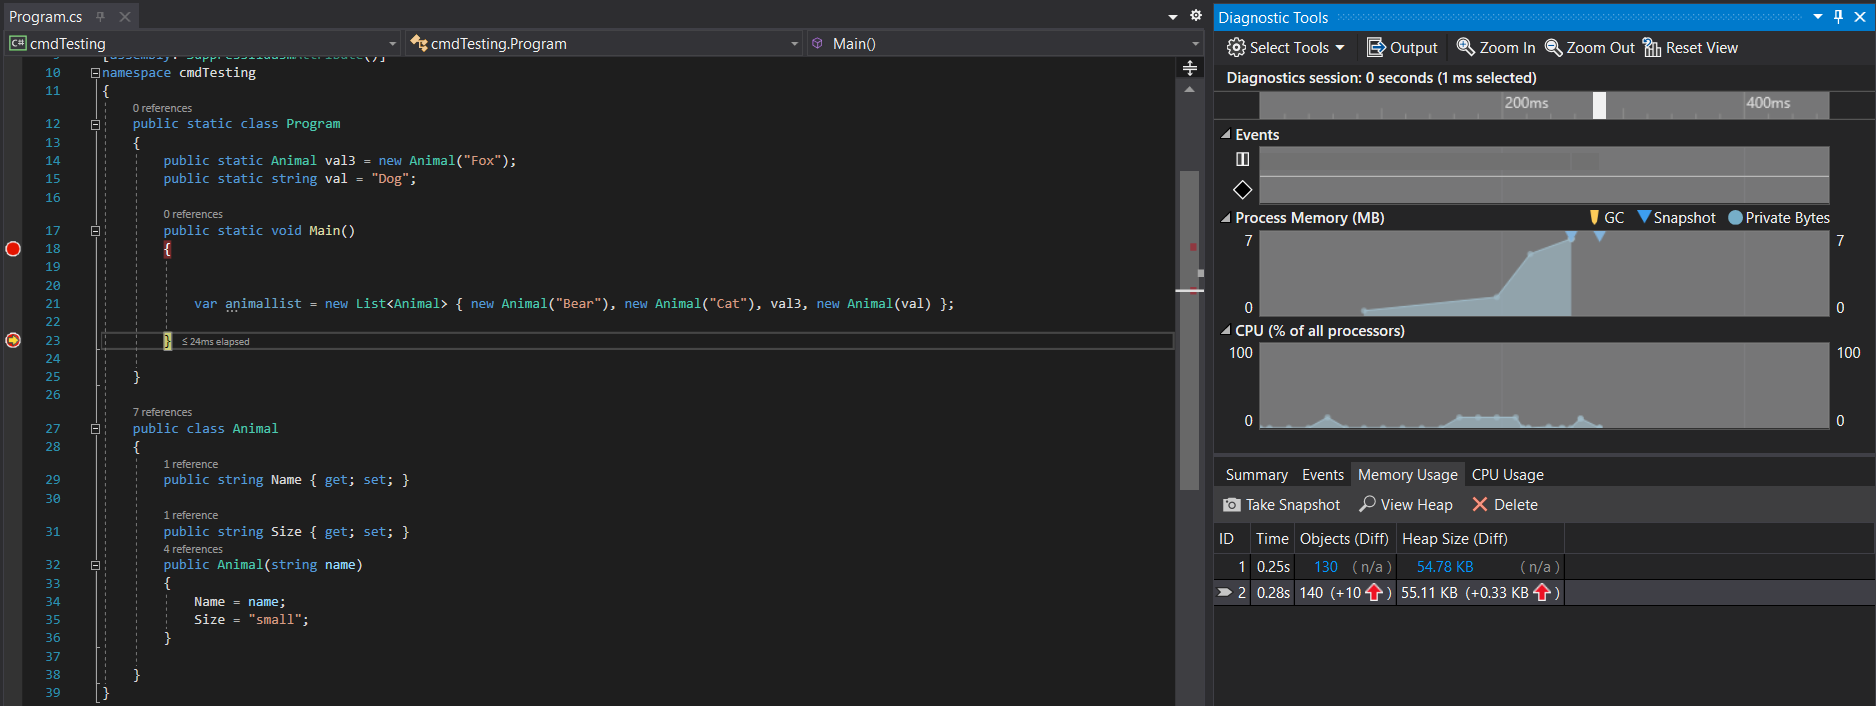
With that in mind there is an incredibly useful view of the GC Heap in Visual Studio that I want to remind people about. It allows you to see memory growth related to the heap. However, it takes a little digging to find it. Go to Debug-> Windows-> Diagnostics Tools.
The Diagnostic Tool is at its best when you want to compare things over time, like say when memory increases or when in CPU usage fluctuates but is still very helpful for specific moments in time. So if you want to take a look at the heap, and I do, you can navigate to the Memory Usage tab and click on the Take Snapshot. This takes a picture of the heap and once stored you can simply click View Heap. In the first image I have taken a Snapshot at the two break points
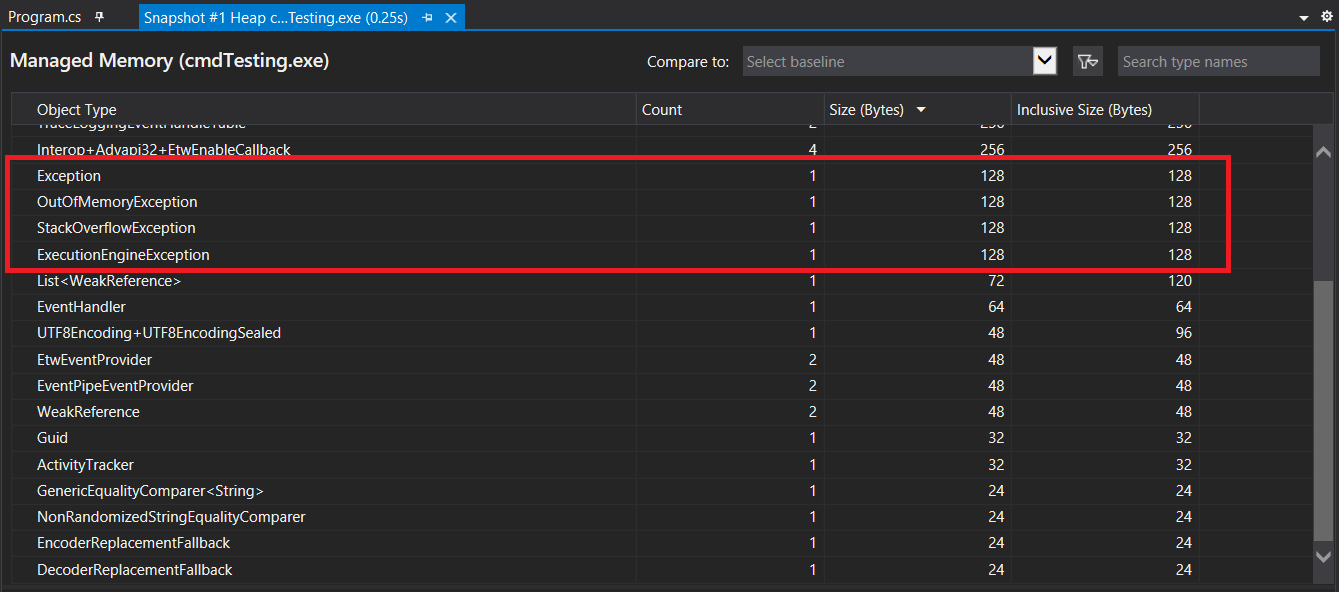
The Snapshot gives shows a list view of all the managed objects on the heap. Now in preceding Snapshot of a very simple command line app there are just two classes, but notice there already seems to be three specific exception objects already on the Stack (OutOfMemoryException, StackOverflowException, ExecutionEngineException). In fact these exceptions exist every time a managed process starts up, so if you were to look at any managed memory dump using WinDbg and say run !dumpheap -type Exception you would see the exact same thing.
Why? Well these three exceptions would impossible to add to the heap after the fact, think about an OutOfMemoryException, by definition you would not be able to add anything else to the heap. To circumvent this the CLR generates these exception objects at startup so that it can throw them whenever the real exception occurs. So when you see these three exceptions with a count of 1 do not worry its probably not your code causing it.
Filtering the Managed Heap
You can filter out objects on the heap to help you focus on the the most important or interesting objects, there are currently only two option “Just My Code” and “Collapse Small Object Types”.
The Just My Code filter 'folds' a list of objects into their parent objects, they essentially become hidden and their size is added to the parent objects. The list was constructed based on some common leak patterns, for example if you have an event handler leak, without this setting, you will see interim nodes of various internal .NET objects between the subscriber and the object raising the event, making it really difficult to spot the true source of the leak. Filtering objects like System.Windows.EventHandlersStore, System.Strings and System.Objects puts your focus on the object allocating and holding onto more resources than they need.
Collapse Small Object Types is a bit more direct in that it looks at the overall size of the Managed Heap and once selected it removes any group of objects that take up less than 0.5% (by default) of the total heap, again, this really helps filter the noise.
Comparing Heaps
This is where the Diagnostics Tools shines you can compare a couple of snapshots and see where unexpected memory growth is occurring.
One other thing to remember here is that all these views are also available for dumps, so if you capture two dumps from the same process you can validate whether you are seeing growth on any heap object by dropping them both in Visual Studio.


Comments are closed.