I am getting amped for the new feature in Visual Studio 2022, and if you want a peak at the latest changes, please consider installing the latest VS 2022 preview along side your existing projects and take it for a spin! I am a debugging and diagnostics nerd so I wanted to share some of my personal favorite features that I think will improve developer productivity.
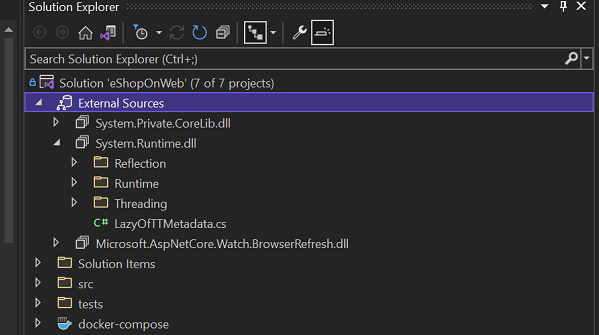
External Sources Node in Solution Explorer
There is an all new External Sources node in Solution Explorer! It currently only appears during live debugging and will show sources for managed modules with symbols loaded that contain Source Server or Source Link info. Basically, if you are debugging, any loaded managed pdb (symbol file) that has Source Server references present will appear under this node. You can browse through files and folders just like any other items, and you can download and review the files locally by double clicking open it in the VS Editor.
Memory Dump Diagnostic Analysis
For obvious reasons (I help developed the feature) this is my favorite set of improvement! If you open memory dumps in Visual Studio you can run a series of Diagnostics Analyzers that help you think about potential problems.
- We have improved the analyzer engine to find more sync-over-async issues in ASP.NET Core memory dumps.
- Find what parts of your code are consuming the most CPU resources by reviewing the top 5 threads by CPU time.
- Review the entire managed heap for signs of memory pressure in Generation 0, 1, 2 and the Large Object Heap.
- If you have a crash dump you can quickly find the second chance exception and thread that caused your application to crash.
- Struggling to form a diagnostics hypothesis? When the exact cause of a crash or hang is not well known you can use Exception analyzer to quickly find and review all exceptions on the heap.
- For those moments when memory analysis is important we have improved the heuristics of Finalizer queue analyzer. We now focus on your code and exclude objects managed by the .NET framework.
- Finding the root call frames when a Stack Overflow Exception occurs can be difficult and time consuming. Our latest analyzers presents a convenient view of the Call Stack and removes repetitive and noisy frames for faster problem analysis.
Breakpoints
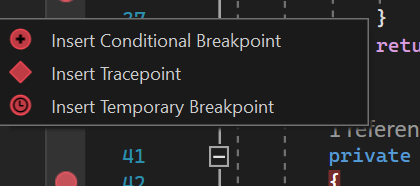
Visual Studio added new breakpoint glyph in the gutter to indicate where you can set a breakpoint.
When you Right click on that breakpoint glyph you activate a new context menu with options to create the following breakpoints in just one or two clicks:-
- Conditional breakpoint
- Tracepoint
- Temporary breakpoint (removed after being hit once).
There are more features on the way! For more details check out the VS Preview Release notes.


Comments are closed.